%load_ext autoreload
Swiss Roll Experiment
import os
import glob
import pickle
import imageio
import pandas as pd
import pyvista as pv

from itertools import product
from matplotlib import pyplot as plt
store_results = True
plot_order = ['dataset', 'ppca_2_components', 'lddmm', 'umap', 'ebm', 'ae', 'vae', 'naf', 'snf', 'fvae', 'nmf']
def read_plot_kwargs(file_name, file_extension='obj'):
    if file_extension == 'obj': f_read = lambda f: pickle.load(open(f,'rb'))
    if file_extension == 'png': f_read = lambda f: imageio.imread(f)
    if file_extension == 'txt': f_read = lambda f: [open(f, "r").read()]

    objs = {os.path.normpath(f).split('/')[-2]:f_read(f)
            for f in glob.glob('../results/swiss_roll/*/{}.{}'.format(
                file_name, file_extension), recursive=True)}
    objs.pop('ppca_3_components')

    return objs
pv.set_plot_theme("document")
pv.set_jupyter_backend('None')
plot_shape = (6, 2)
def plotter_for_each_panel(axis, f_plot, plot_kwargs, plot_shape):
    keys = list(plot_kwargs.keys())
    keys.sort(key=lambda e: plot_order.index(e))
    n_keys = len(keys)
    for i in range(plot_shape[0]):
        for j in range(plot_shape[1]):
            index = i * plot_shape[1] + (j)
            if index == n_keys:
                return
            key = keys[index]

            plotter.subplot(i, j)
            plotter.add_text(key, font_size=24)
            f_plot(**plot_kwargs[key], axis=axis)

def image_plotter_for_each_panel(imgs, plot_shape):
    keys = list(imgs.keys())
    keys.sort(key=lambda e: plot_order.index(e))
    max_index = min(plot_shape[0]*plot_shape[1], len(keys))
    for i in range(0, max_index):
        key = keys[i]
        g = fig.add_subplot(*plot_shape, i+1)
        g.title.set_text(key)
        plt.axis('off')
        plt.imshow(imgs[key])
Input Representation
imgs = read_plot_kwargs('base_representation', 'png')
fig = plt.figure(figsize=(plot_shape[1]*10,plot_shape[0]*10))
image_plotter_for_each_panel(imgs, plot_shape)
plt.show()
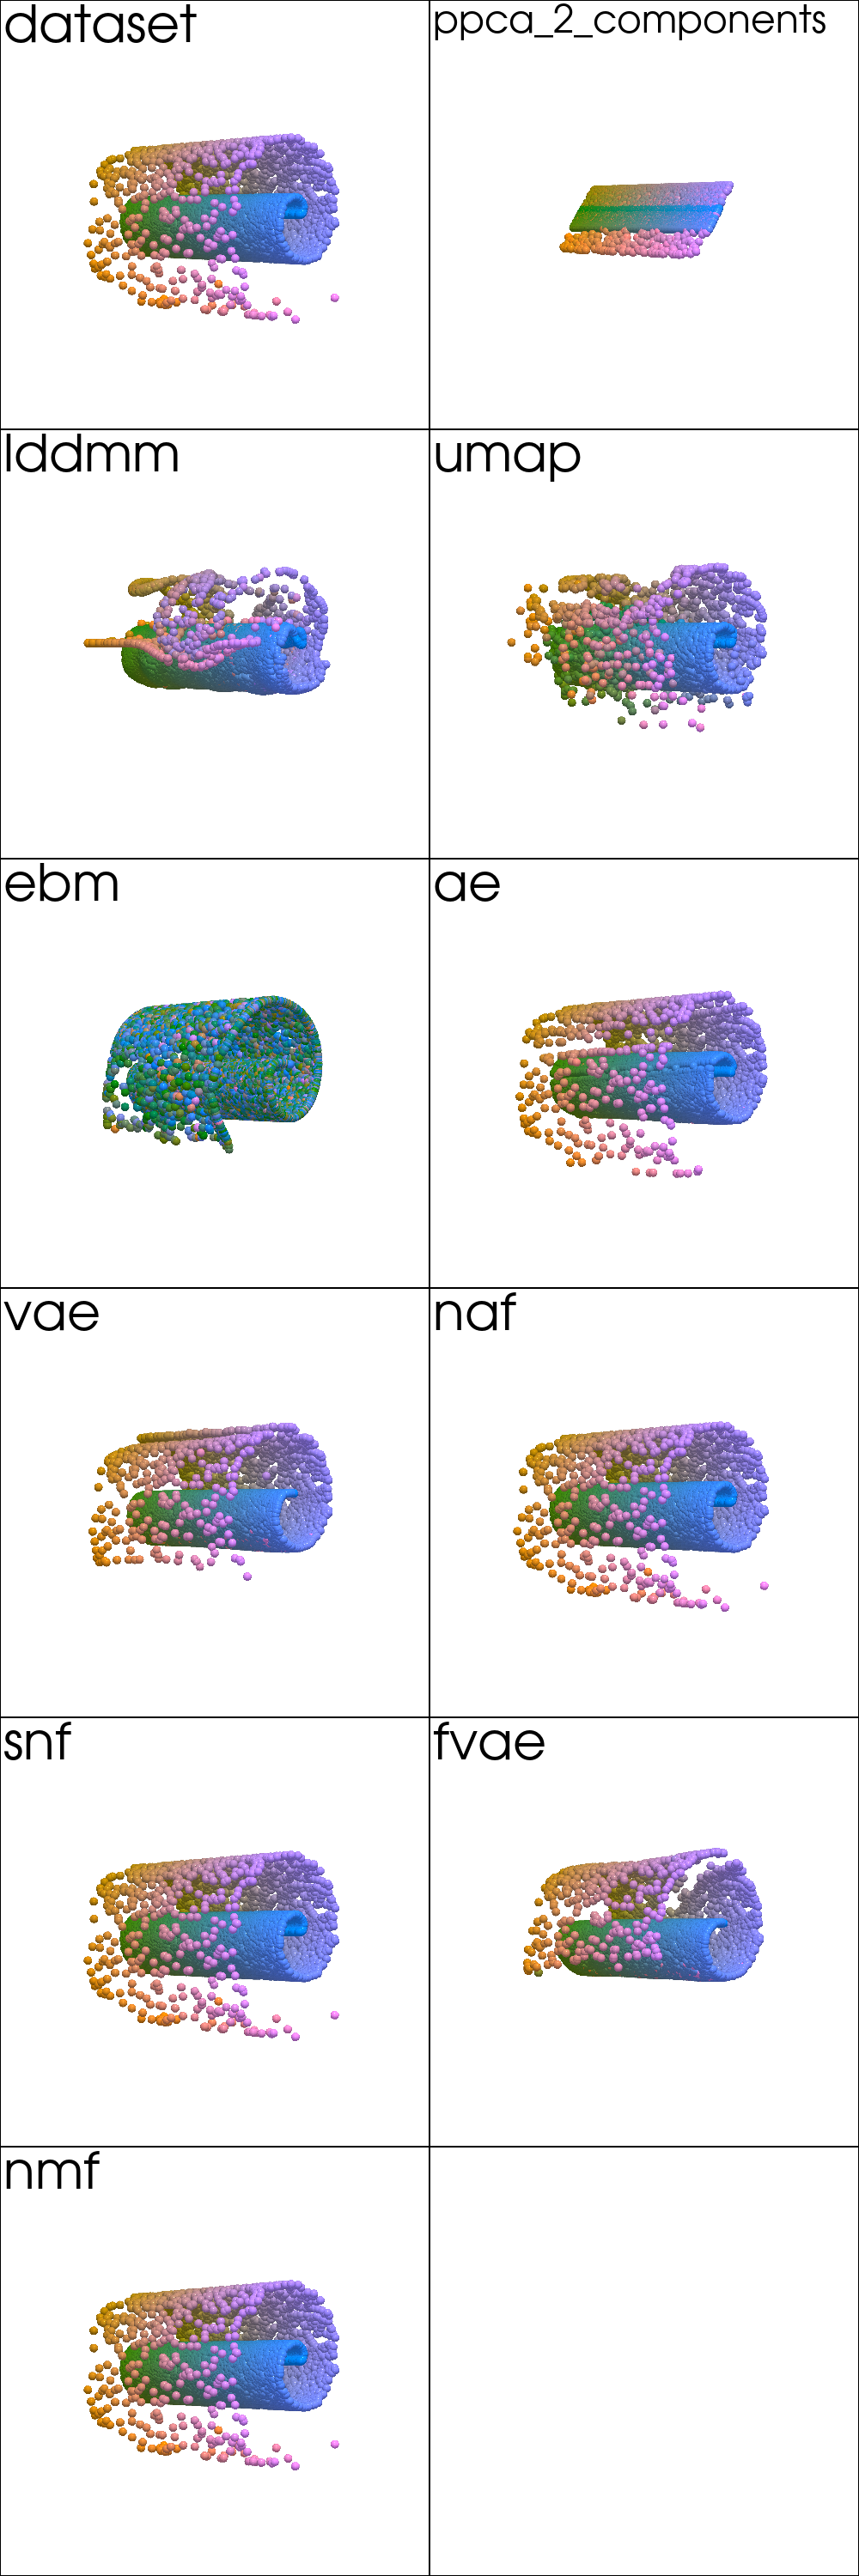
Input Reconstruction
mse_errors = read_plot_kwargs('reconstruction', 'txt')
df_reconstruction = pd.DataFrame.from_dict(mse_errors, orient='index', columns=['MSE'])
df_reconstruction.reindex(plot_order)
| MSE | |
|---|---|
| dataset | NaN |
| ppca_2_components | 10.422249043973492 |
| lddmm | 5.1534423828125 |
| umap | 1.7059484720230103 |
| ebm | 135.48646545410156 |
| ae | 0.19316305220127106 |
| vae | 0.8526504635810852 |
| naf | 8.366670272152987e-07 |
| snf | 2.8050467903995013e-07 |
| fvae | 0.9597674012184143 |
| nmf | 0.0002189374208683148 |
from pdmtut.vis import plot_reconstruction

plot_kwargs = read_plot_kwargs('reconstruction')
plotter = pv.Plotter(shape=plot_shape, window_size=(500*plot_shape[1], 500*plot_shape[0]))

plotter_for_each_panel(plotter, plot_reconstruction, plot_kwargs, plot_shape)

plotter.link_views()
plotter.camera_position = [(-65, 0, 65), (0, 0, 0), (0, 1, 0)]
_ = plotter.show()
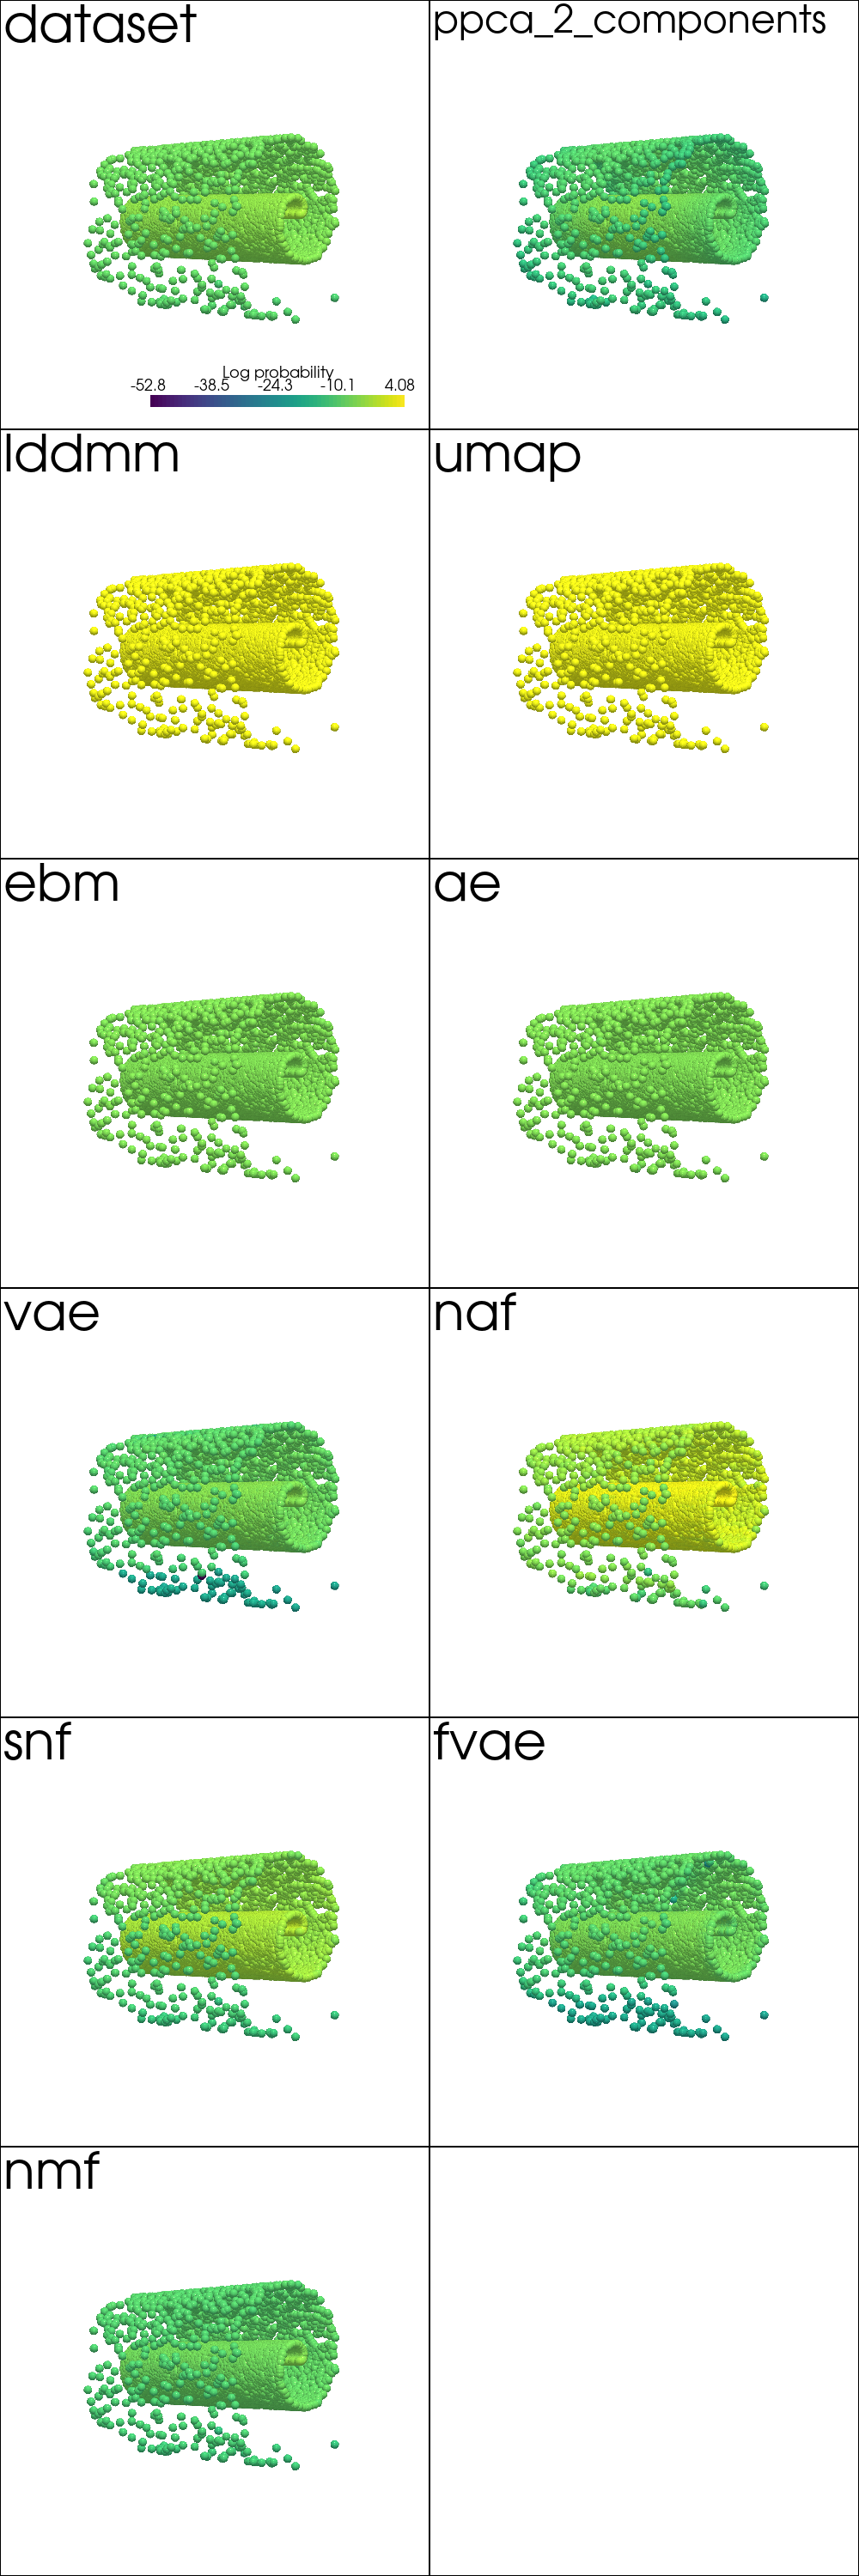
Density Estimation
data_log_likelihood = read_plot_kwargs('density', 'txt')
df_density = pd.DataFrame.from_dict(data_log_likelihood, orient='index', columns=['Log Likelihood'])
df_density.reindex(plot_order)
| Log Likelihood | |
|---|---|
| dataset | NaN |
| ppca_2_components | -8.538554969111125 |
| lddmm | 1.0 |
| umap | 1.0 |
| ebm | -7.6159820556640625 |
| ae | -7.60769510269165 |
| vae | -7.7125563621521 |
| naf | 0.27156203985214233 |
| snf | -4.133373737335205 |
| fvae | -8.800947189331055 |
| nmf | -8.880420684814453 |
from pdmtut.vis import plot_density

plot_kwargs = read_plot_kwargs('discrete_density')
plotter = pv.Plotter(shape=plot_shape, window_size=(500*plot_shape[1], 500*plot_shape[0]))

plotter_for_each_panel(plotter, plot_density, plot_kwargs, plot_shape)

plotter.link_views()
plotter.camera_position = [(-65, 0, 65), (0, 0, 0), (0, 1, 0)]
_ = plotter.show()
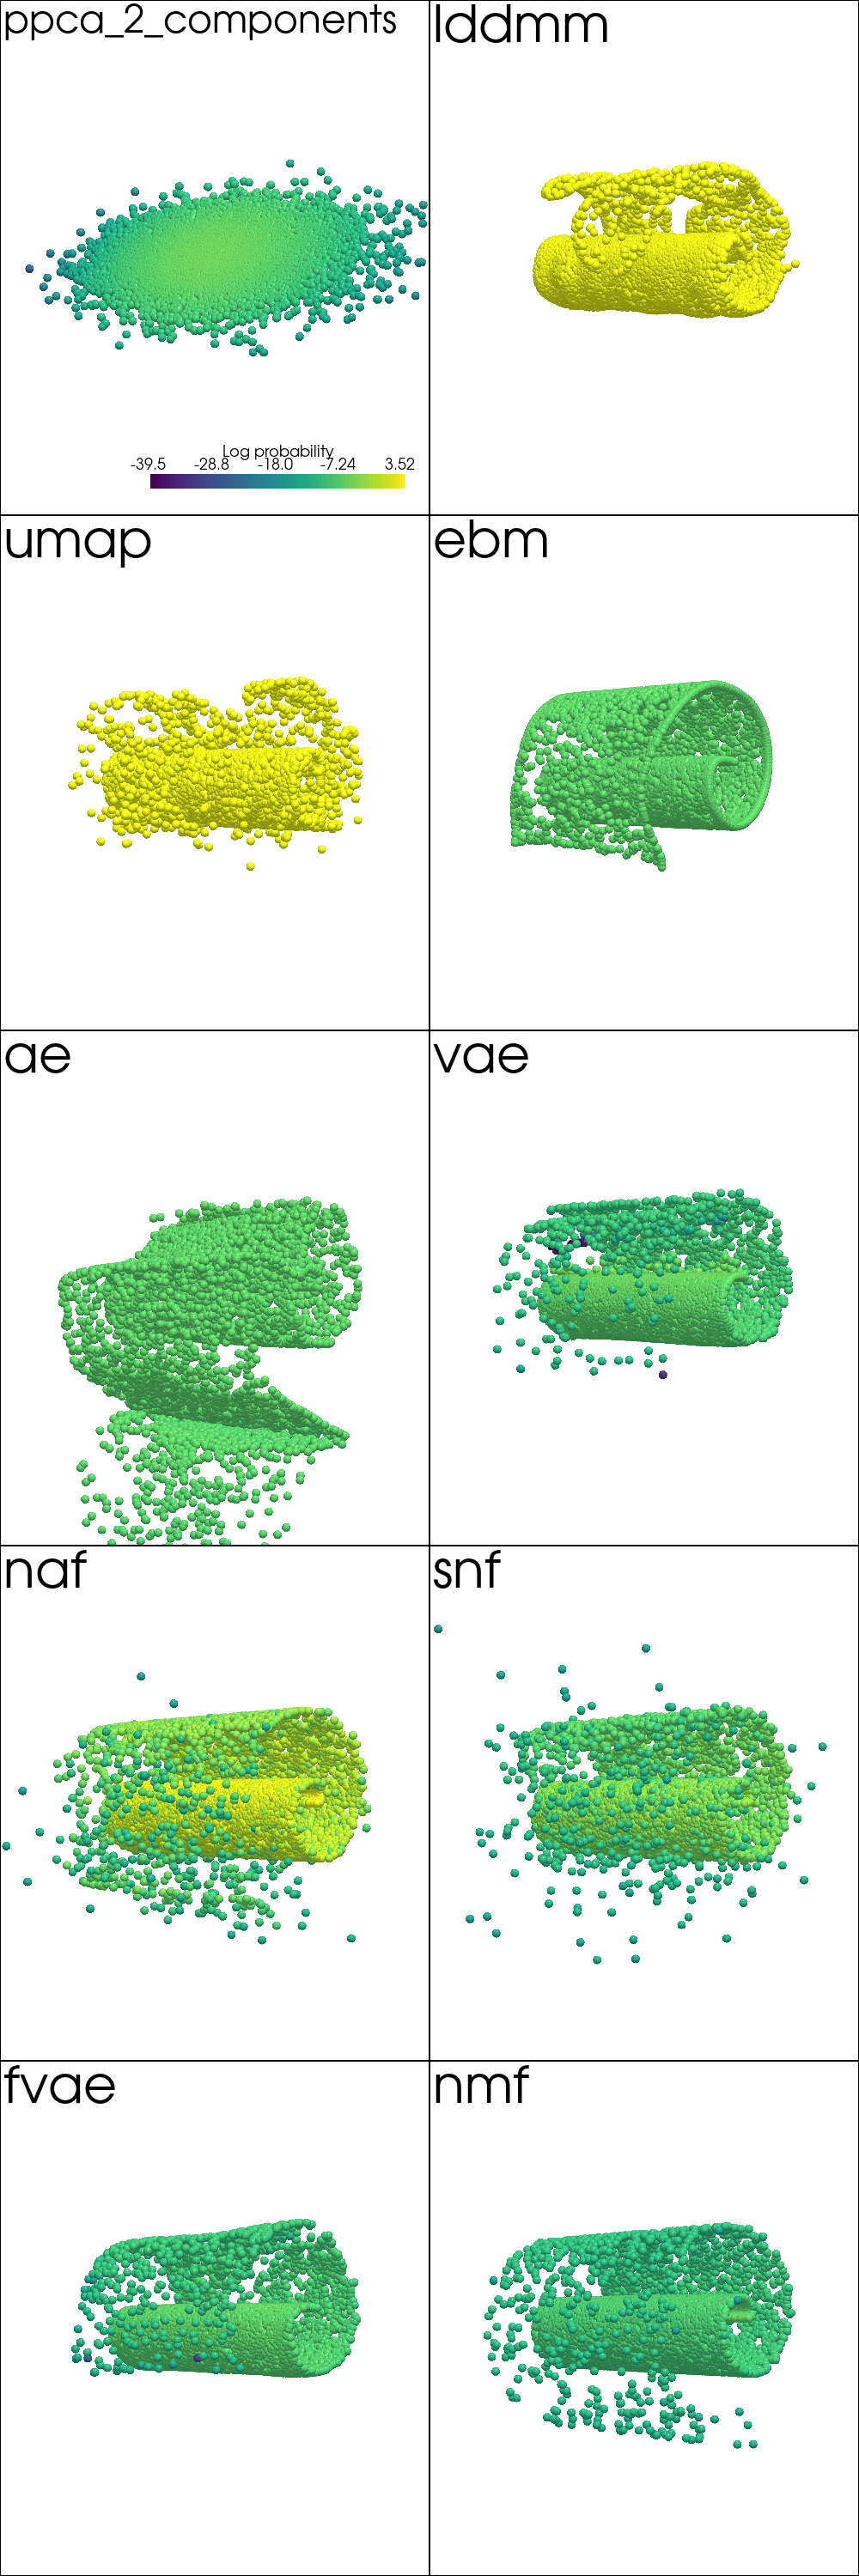
Generate Samples
from pdmtut.vis import plot_generated_samples

plot_kwargs = read_plot_kwargs('generated_samples')
plotter = pv.Plotter(shape=(plot_shape[0]-1, plot_shape[1]), window_size=(500*plot_shape[1], 500*plot_shape[0]))

plotter_for_each_panel(plotter, plot_generated_samples, plot_kwargs, (plot_shape[0], plot_shape[1]))

plotter.link_views()
plotter.camera_position = [(-65, 0, 65), (0, 0, 0), (0, 1, 0)]
_ = plotter.show()
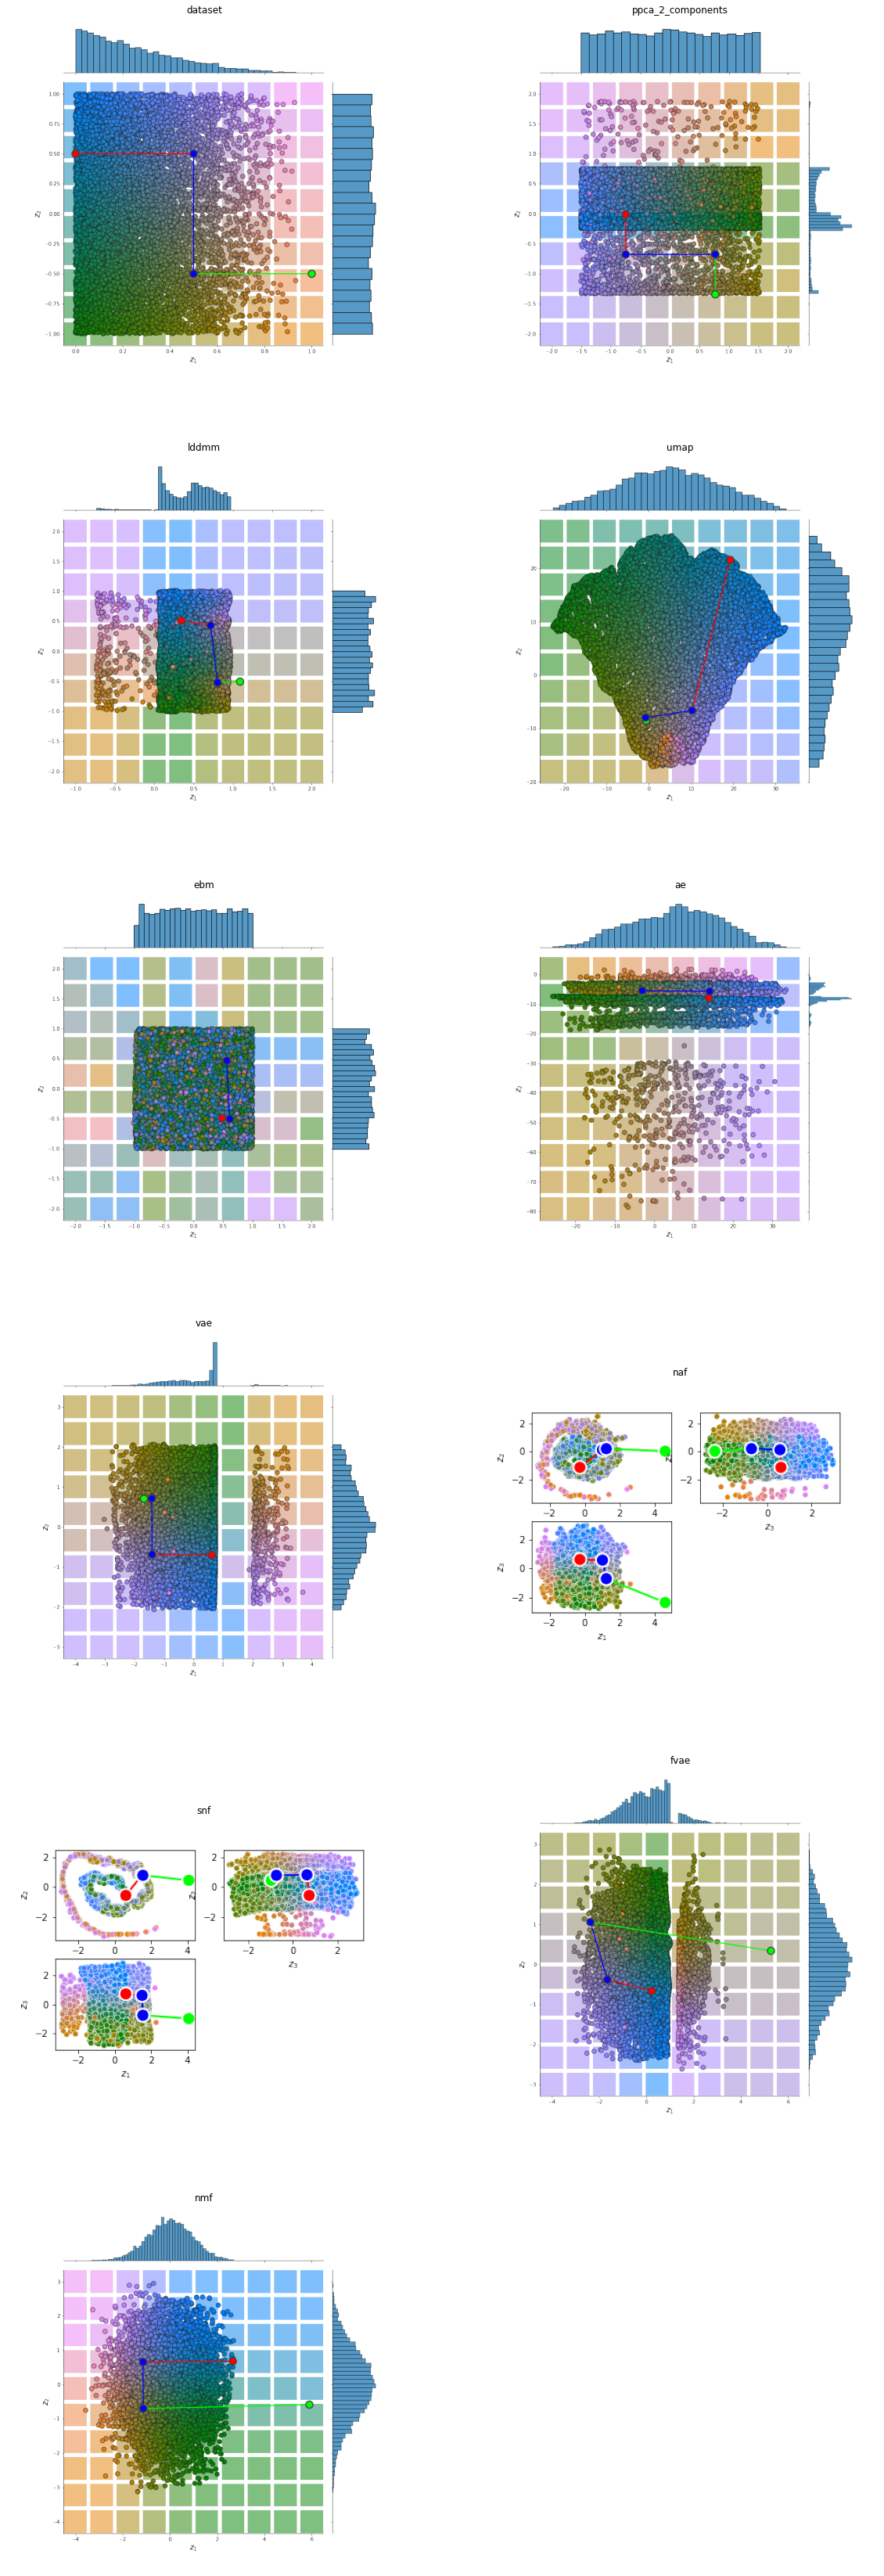
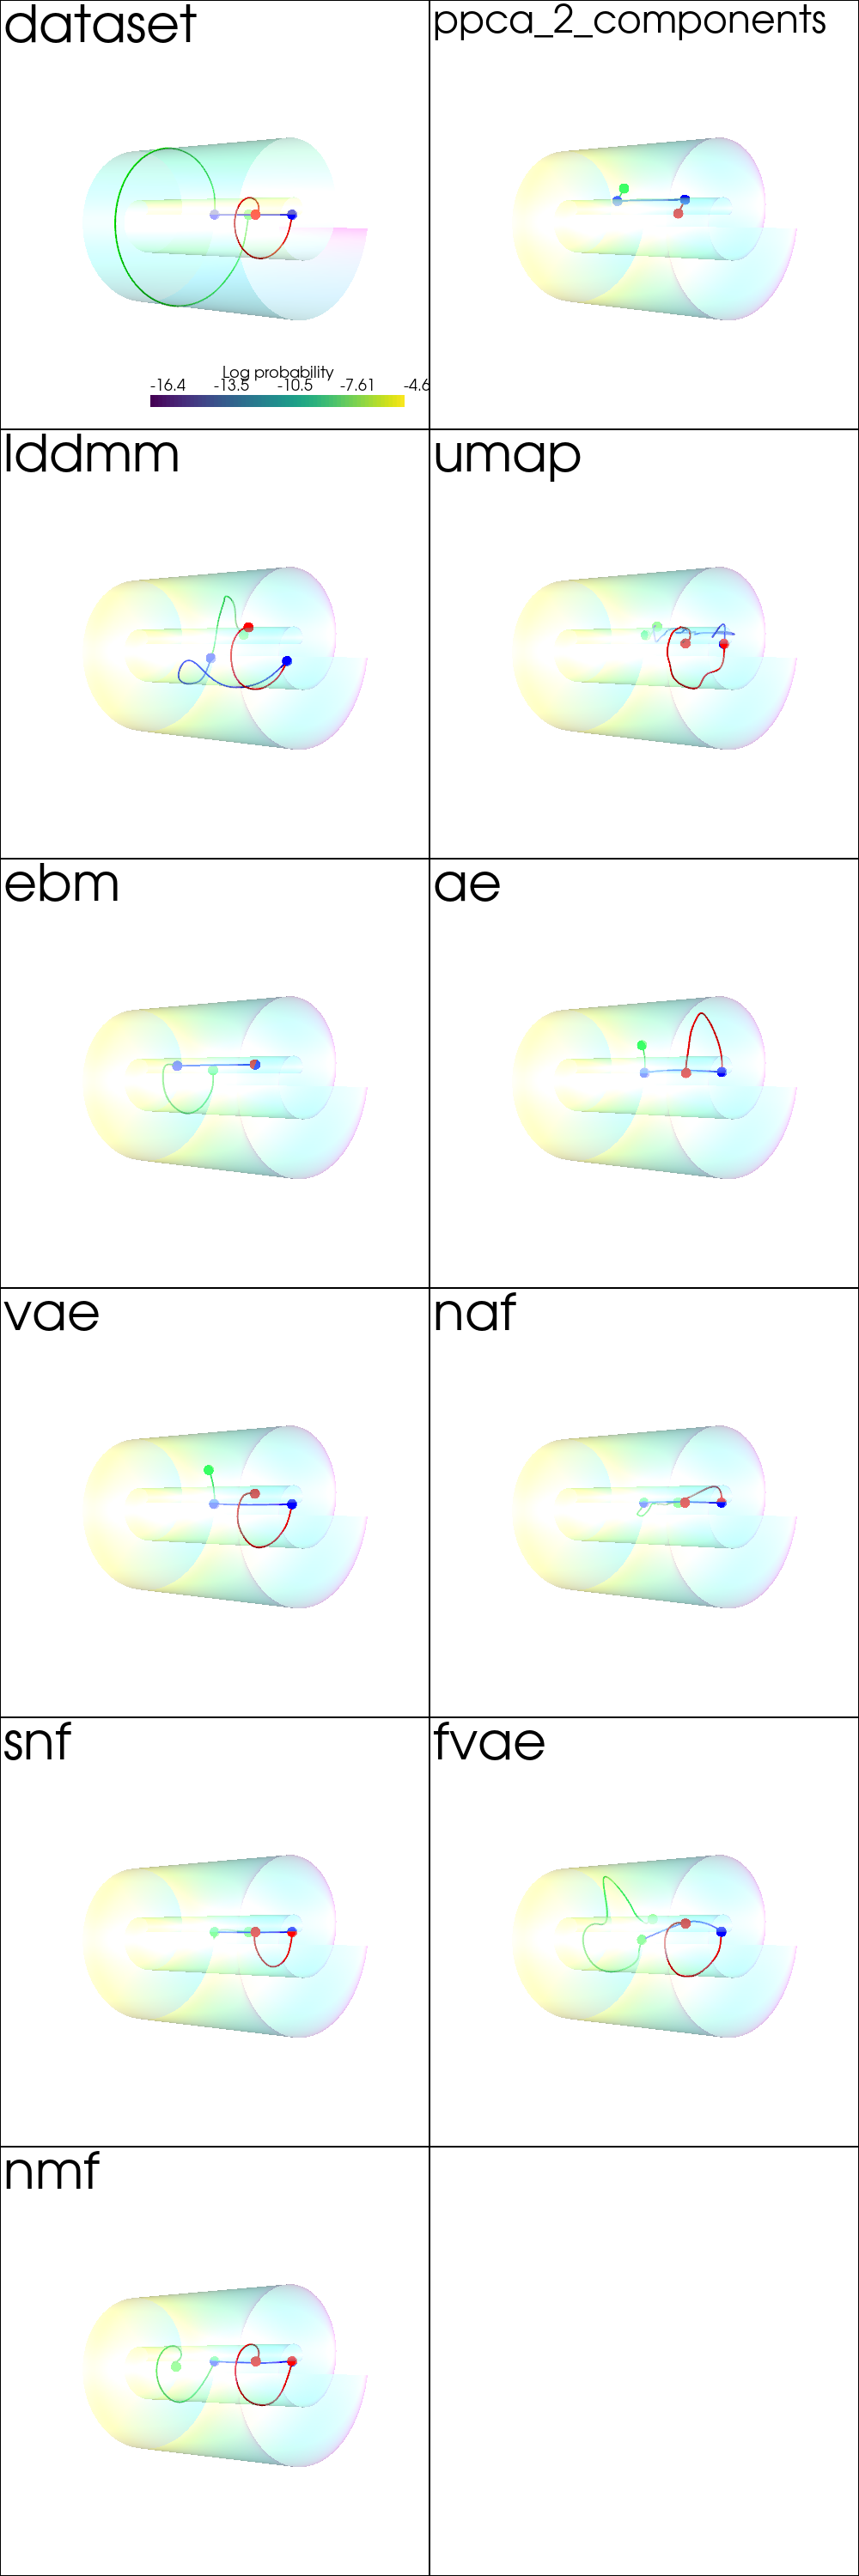
Interpolation
from pdmtut.vis import plot_interpolation

plot_kwargs = read_plot_kwargs('interpolation')
plotter = pv.Plotter(shape=plot_shape, window_size=(500*plot_shape[1], 500*plot_shape[0]))

plotter_for_each_panel(plotter, plot_interpolation, plot_kwargs, plot_shape)

plotter.link_views()
plotter.camera_position = [(-65, 0, 65), (0, 0, 0), (0, 1, 0)]
_ = plotter.show()
Extra
table = pd.concat([df_reconstruction, df_density], axis=1)
print(table.reindex(plot_order).astype('float64').round(2).to_latex())
\begin{tabular}{lrr}
\toprule
{} &     MSE &  Log Likelihood \\
\midrule
dataset           &     NaN &             NaN \\
ppca\_2\_components &   10.42 &           -8.54 \\
lddmm             &    5.15 &            1.00 \\
umap              &    1.71 &            1.00 \\
ebm               &  135.49 &           -7.62 \\
ae                &    0.19 &           -7.61 \\
vae               &    0.85 &           -7.71 \\
naf               &    0.00 &            0.27 \\
snf               &    0.00 &           -4.13 \\
fvae              &    0.96 &           -8.80 \\
nmf               &    0.00 &           -8.88 \\
\bottomrule
\end{tabular}